Dashboard: Reports
Over the past several weeks we’ve taken a look at forScore 9’s new Dashboard feature. If you missed them, be sure to check out our previous articles discussing the Analytics and Goals tabs in the Dashboard interface. Today we’ll be discussing the third and final tab, Reports.
While Analytics offer you a way to view your statistics, and Goals guide you to a specific outcome, Reports are used to collate and share information about your practice habits with others (or to archive them for your own purposes). The Reports tab lets you create templates based on certain criteria, then generate a PDF file from that template at any time and share it however you like.
Tap the + button to create your first report template, and tap the circled arrow button on the right-hand side to view and edit its settings. Give it a name, make it item- or setlist-specific if you like, and set a time interval: daily, weekly, or monthly. Choose how far back the report should go (i.e. the last three days, the last four weeks, or two months) and whether or not to include the current day, week or month. Finally, if you haven’t picked a specific item or setlist to focus on, you can choose whether or not your report should include statistics for items, for setlists, or for both.
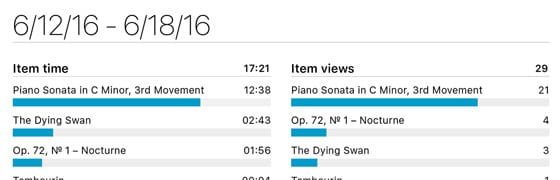
Back in the main Reports view, tap your report to generate a PDF file and see how all of your data is tallied up and presented. Tap the share icon in the top right-hand corner of the screen to share or print your report.
That completes our tour of Dashboard, so now you’re ready to practice armed with more data than ever before and the right tools to take full advantage of it.