Dashboard
If you allow it, forScore can track which scores, bookmarks, and setlists you view and for how long. With this information collected, the Dashboard feature in the tools menu can give you valuable insights into your playing habits and helps keep you on track. Three tabs along the top or bottom of the screen (shown on the left of the screen in a sidebar when space allows) give you different ways of viewing and using this information:
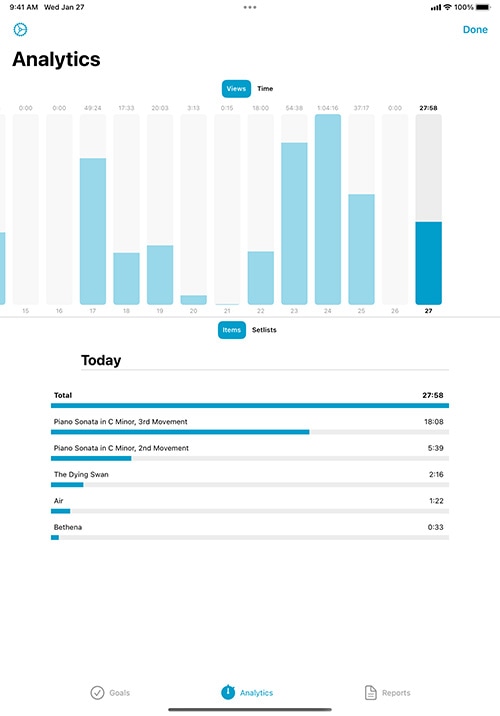
Analytics
The Analytics tab shows information collected over the past ninety days. It can show you statistics for either items (scores and bookmarks) or setlists, and displays either the total amount of time you spent playing or the number of views.
Tap on any day to see a detailed list of items or setlists in the lower portion of the screen. This list shows everything you viewed on that particular day and is sorted from most played or viewed to least. You can tap on any item or setlist in this list to see how often you’ve viewed or played it over the past ninety days.
Goals
The Goals tab helps you reach a minimum number of views or amount of play time for each day, week, month, or all time. Goals can be item- or setlist-specific, or they can be more general.
The main list of goals shows your current progress as a circular view and, if your goal is time-specific, uses an additional view in the lower left-hand corner to show your results for the previous term. For instance, a weekly goal would prominently display this week’s progress with a smaller view for last week’s results.
Tap a goal to edit it or to view your results for the past ninety days. The timeline along the top of the screen shows your results for the past ninety days: tap on any of these graphics to share your progress with friends or colleagues via email, message, Twitter, Facebook, and more. It’s a great way to hold yourself accountable or to share your success.
Reports
The Reports tab lets you periodically share more detailed information with a colleague or instructor as a PDF document. To begin, create a new report template and tap the circled arrow button to edit it.
Here, you can customize your report to display progress for all items and/or setlists or for one in particular. Select day, week, or month, and choose how far back you’d like the report to go. Once you’re done, tap the back button and tap the report to view its results and use the action button in the top right-hand corner to share it.
Note: The information forScore collects is stored locally on your device. It doesn’t get sent to any servers, and won’t be shared with anyone unless you specifically choose to do so. Visit forscore.co/privacy to learn more.