Dashboard: Analytics
When we introduced Dashboard last year with forScore 9, we knew it was unlike any feature we had ever created. It required secure data collection and brand new interface elements that could present complex data in a logical, useful way.
To achieve this, we designed Dashboard with three specific uses in mind. Goals, Analytics, and Reports. Over the next few weeks we’ll be taking a look at each, and we’ll start with Analytics.
If you allow it, forScore collects information about which setlists, scores, and bookmarks you view and for how long. This data collection is secure (never stored anywhere other than on your own device) and strictly opt-in, so the first time you open Dashboard you’ll be asked to agree to allow forScore to begin collecting data. Once you’ve done so, you’ll see the Analytics tab; it’ll be empty since there’s no data yet, 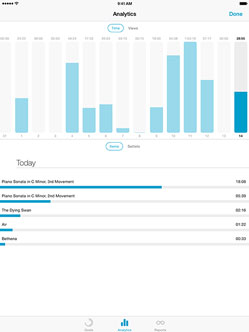 but after you’ve spent some time playing you’ll be able to come back and see what Dashboard can do.
In the top section, you can see a daily total of your play time and number of views. Below that, you’ll see a list of the items or setlists you played, sorted from most played to least. Tap on any of those items to see the day-to-day play time and number of views (like the same chart at the top of the screen, but just for that specific item).
These graphs already give you a lot of insight into your playing habits, but there’s a lot more you can do with it. Be sure to check back next week when we’ll be discussing the Goals tab!