Some of the new features in forScore 10 are complex, but others—like the new ruler annotation tool—are very straightforward (pardon the pun). While annotating, tap the new ruler icon to show or hide it. It’s semi-transparent and, most importantly, straight.
Use two fingers to rotate it, or drag it around on the screen to place it exactly where you need it. It works with your drawing presets and the Stamp and Shape tools. Start drawing near either side and forScore will lock your input to the ruler’s edge. Or start drawing out in the open and the ruler will stop your drawings from going too far if needed.
And, well, that’s about it. You don’t always need precision, but when you do the new Ruler tool is there for you.
For an app designed to give you the best, clearest possible view of your music, cropping is an essential part of the equation. It helps you remove unnecessary margins, zooming and repositioning each page until it fits perfectly on the screen.
Now, with forScore 10, the Crop tool can do even more: it can now help you fix crooked scans by tilting the page up to twenty degrees in either direction. It’s not a separate function, it’s part of the cropping process so you can line up your page once and never have to think about it again. Just drag the slider at the top of the page left or right until everything looks good (if you’ve already cropped your page you’ll need to un-crop it first).
Your annotations, links, and buttons are all adjusted to line up properly with the page, but since things like text annotations need to stay horizontal there may be some subtle differences. For the best possible results, be sure to crop and de-skew any problem pages first.
Last week we began our journey through all of the new features in forScore 10 and forScore mini 3 with a look at audio track playback speed adjustment. That’s just one half of what’s new in our newly upgraded audio system, and today we’ll check out the second half: pitch adjustment.
This feature lets you transpose an audio track up to an octave in either direction. It’s something we know a lot of our customers do, and previously they’ve had to rely on third-party apps, switching back and forth as needed. You can still do that, of course, but now there’s a fully integrated solution that’s much easier to use.
As we mentioned last time, the newest versions of forScore actually switch between three distinct audio engines on the fly to give you the best possible features at all times, even though your audio tracks might come from a number of different sources. The requirements for pitch adjustment are a little more stringent than playback speed, requiring iOS 8 or later and compatible only with non-DRMed, locally stored audio files (either added directly to forScore’s documents directory or from your iTunes music library but not stored in the cloud).
Tap the media box’s knob/dial icon to access the speed and pitch adjustment panel, and you’ll see two adjustment rows for semitones and cents. Each slider allows for quick adjustments, and the +/- buttons on the right let you make more precise adjustments. As with playback speed, these sliders may be disabled until you press play and forScore can access more of the track’s information. Like playback speed, pitch adjustments are saved automatically per track, so you can transpose one track without affecting the rest.
That’s what’s new in audio track playback with forScore 10 and forScore mini 3, but we’ll be back next week and onward with a whole lot more, so stay tuned!
This week’s big news is the release of forScore 10 and forScore mini 3, and we’ve got tons of fresh features to explore! Today we’ll start with one of our favorites, the ability to adjust the playback speed of an audio track while following along with the corresponding sheet music. It’s an especially great tool for learning, and we think its newly expanded flexibility will really make a difference.
Audio tracks can come from several different places, and some of the tools forScore uses are only available in newer versions of iOS, so we actually wrap three distinct audio engines into one unified interface. This lets us provide the best possible experience at all times, instead of just defaulting to the lowest common denominator. This is how it works:
- External audio, DRMed audio tracks, or tracks stored in the cloud can be slowed down to roughly 50% or 75% of their original speed, just like in earlier versions of forScore
- All other tracks, including recordings and files you’ve added to forScore’s Documents directory can be played anywhere from 25% to 200% of their original speed
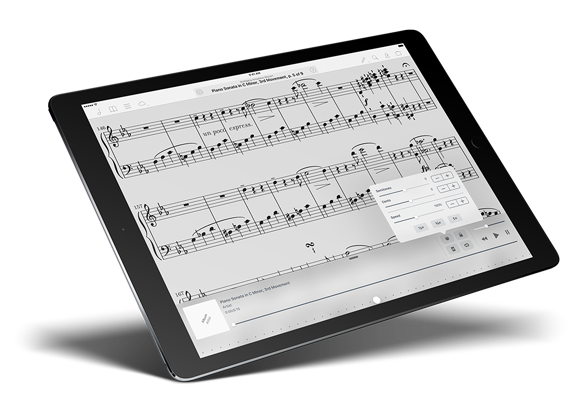
When you load up a song, you’ll see forScore’s media box appear along the bottom of the screen. Tap the knob/dial icon to access the speed and pitch adjustment panel, and you’ll see which options are available to you based on the track’s source. You’ll see the half, three quarter, and full speed buttons, and a slider that gives you more fine-grained control over speed. By default, this slider is disabled until 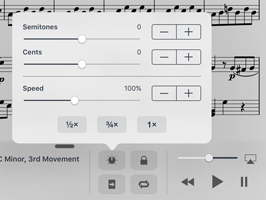 forScore can access the track’s information—in some cases, that can only happen once you’ve pressed play.
Drag the slider left to slow your track down, or right to speed it up. For precise adjustments, use the + and – buttons on the right-hand side of the panel. Speed is saved automatically per track, so you can leave your score and come back later with everything right where you left it.
Today we’re very excited to announce the arrival of forScore 10 and forScore mini 3 on the App Store. These huge updates are absolutely free for all existing users, as always, and they include some incredible new features and enhancements that really take so many of forScore’s key functions to the next level. From brand new annotation tools and powerful audio track adjustments to setlist folders and the seriously upgraded Darkroom, they make everyday tasks easier, faster, and better.
Thanks to everyone who supported us and helped us get here, all the way up to version ten and beyond! We love working on forScore and appreciate the continued opportunity to bring you our latest ideas and improvements. And, of course, a very big thank you to our tremendous team of beta testers: they volunteer their time to try out our rough drafts, help us hone in on issues, and give us their feedback on all the changes we make. Thank you all.
Available now for iPad
Available now for iPhone and iPod Touch
