 Since they were first introduced, forScore’s annotation tools have been largely static and cumulative: once you hit that save button the only option to change a specific drawing was to erase and redo it. In forScore 10, the new selection tool changes all of that.
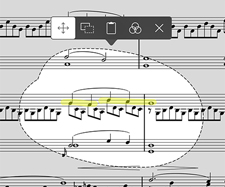
Now you can use your finger or Apple Pencil to select a specific area of drawn annotations (including stamps and shapes) and then move, duplicate, or clear them without affecting any of your other annotations. There’s also an adjustment tool that lets you re-color annotations by adjusting their hue, saturation, brightness, and opacity. You can even copy and paste drawn annotations, and it works between pages or between completely different files. It’s a powerful tool that can save you a lot of time and effort, so be sure to check it out the next time your annotations need a little tweaking.
Long-time user, frequent contributor, and honorary employee Alan Steinberger has shared a few music videos with us featuring him playing from his iPad with singer Matt Forbes. There are a few shots of forScore sprinkled throughout several of them, most prominently in a cover version of Rod Stewart’s “Some Guys Have All The Luck” as seen below:
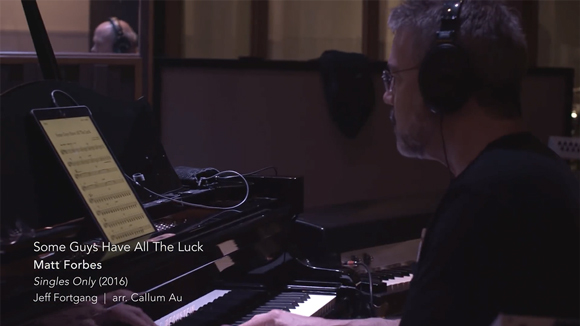
Learn more about Alan here, and check out all of Matt’s videos on his Facebook page.
Some of the new features in forScore 10 are complex, but others—like the new ruler annotation tool—are very straightforward (pardon the pun). While annotating, tap the new ruler icon to show or hide it. It’s semi-transparent and, most importantly, straight.
Use two fingers to rotate it, or drag it around on the screen to place it exactly where you need it. It works with your drawing presets and the Stamp and Shape tools. Start drawing near either side and forScore will lock your input to the ruler’s edge. Or start drawing out in the open and the ruler will stop your drawings from going too far if needed.
And, well, that’s about it. You don’t always need precision, but when you do the new Ruler tool is there for you.
For an app designed to give you the best, clearest possible view of your music, cropping is an essential part of the equation. It helps you remove unnecessary margins, zooming and repositioning each page until it fits perfectly on the screen.
Now, with forScore 10, the Crop tool can do even more: it can now help you fix crooked scans by tilting the page up to twenty degrees in either direction. It’s not a separate function, it’s part of the cropping process so you can line up your page once and never have to think about it again. Just drag the slider at the top of the page left or right until everything looks good (if you’ve already cropped your page you’ll need to un-crop it first).
Your annotations, links, and buttons are all adjusted to line up properly with the page, but since things like text annotations need to stay horizontal there may be some subtle differences. For the best possible results, be sure to crop and de-skew any problem pages first.
Last week we began our journey through all of the new features in forScore 10 and forScore mini 3 with a look at audio track playback speed adjustment. That’s just one half of what’s new in our newly upgraded audio system, and today we’ll check out the second half: pitch adjustment.
This feature lets you transpose an audio track up to an octave in either direction. It’s something we know a lot of our customers do, and previously they’ve had to rely on third-party apps, switching back and forth as needed. You can still do that, of course, but now there’s a fully integrated solution that’s much easier to use.
As we mentioned last time, the newest versions of forScore actually switch between three distinct audio engines on the fly to give you the best possible features at all times, even though your audio tracks might come from a number of different sources. The requirements for pitch adjustment are a little more stringent than playback speed, requiring iOS 8 or later and compatible only with non-DRMed, locally stored audio files (either added directly to forScore’s documents directory or from your iTunes music library but not stored in the cloud).
Tap the media box’s knob/dial icon to access the speed and pitch adjustment panel, and you’ll see two adjustment rows for semitones and cents. Each slider allows for quick adjustments, and the +/- buttons on the right let you make more precise adjustments. As with playback speed, these sliders may be disabled until you press play and forScore can access more of the track’s information. Like playback speed, pitch adjustments are saved automatically per track, so you can transpose one track without affecting the rest.
That’s what’s new in audio track playback with forScore 10 and forScore mini 3, but we’ll be back next week and onward with a whole lot more, so stay tuned!